//server/stuff/Profiler>
Main
C++ Profiler
This is a program which I wrote because I needed a simple and functional low-level C++ profiler. I have previously written a high level sample based profiler, but it can't give profiling results about every possible function unless registered with it, so I've only used it in major functions. This profiler uses the /Gh and /GH compiler flags of MSVC++ to hook two functions, _penter and _pexit to every function within a project. This only requires it to be recompiled, without any source code modifications. It quickly records the stack configuration and duration the stack remains in that configuration with some ASM magic (No function calls used in these two functions. Possible, but slow as calling another function would call _penter again), dumping them to file at the end of a profiled frame. Windows symbol information is then used to map addresses to source modules and functions.
New screenshots:
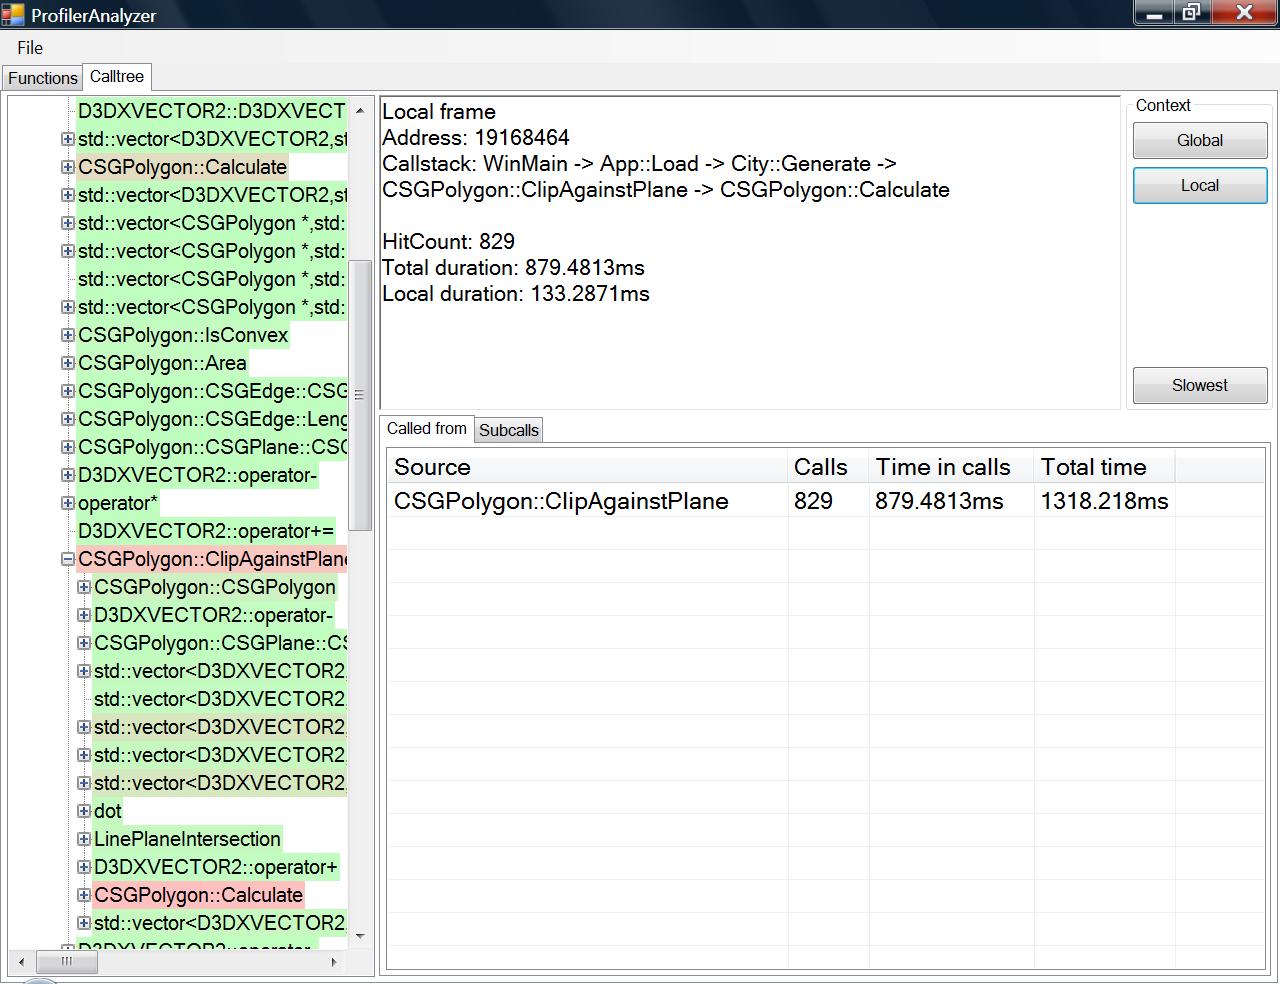
A call frame in the call tree, showing a function in its local context where the callstack is only in the given configuration:
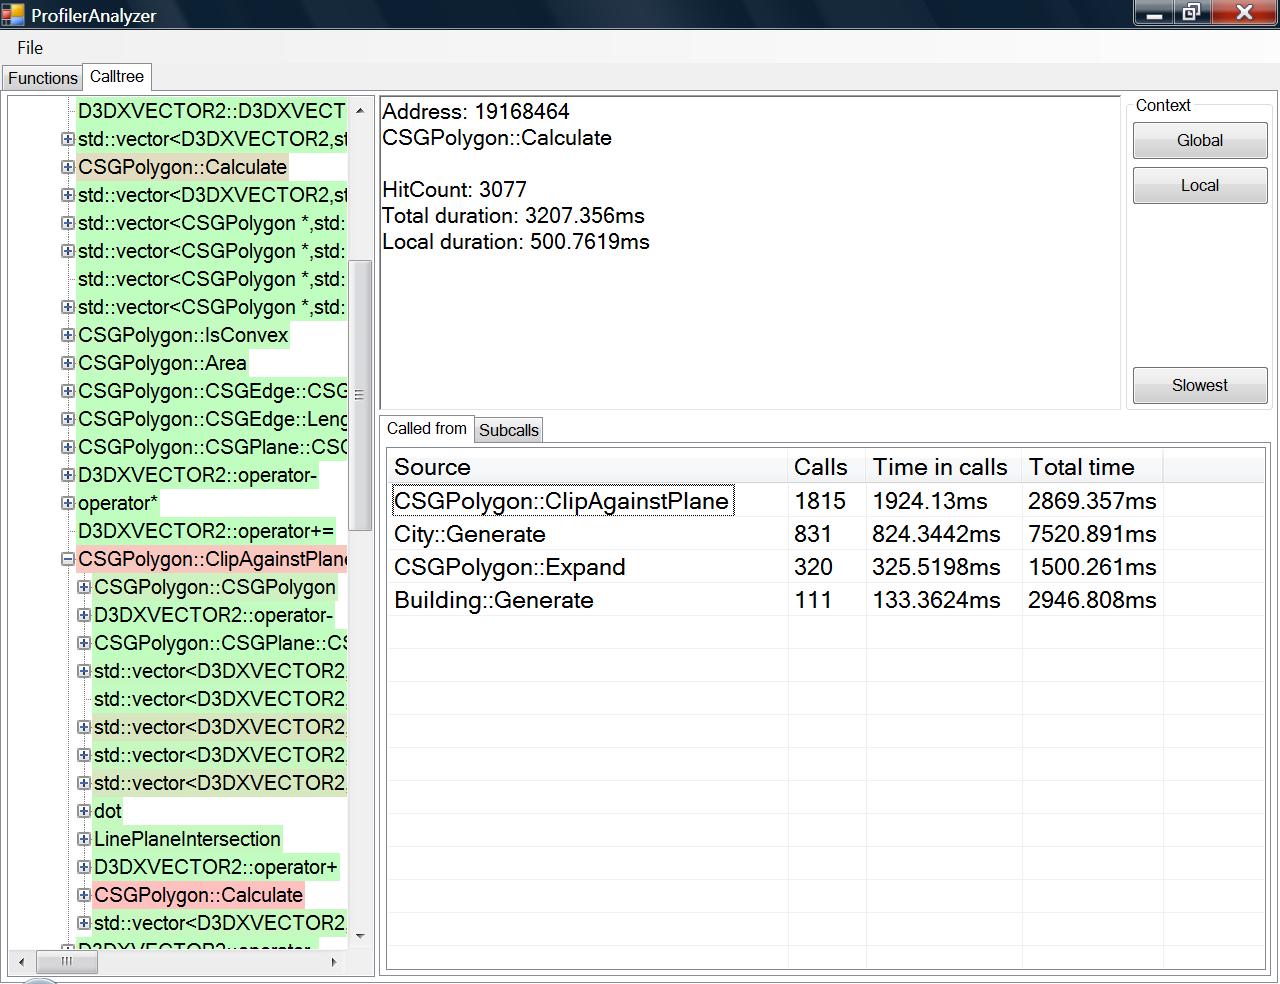
 And switched to the global context, the overall view of this function:
Old test case:
 A simple test scenario -- I have written a small deferred shader demo to try this out, with no CPU optimizations and making heavy usage of the STL libraries, as heavy as I can get without really doing badly on purpose. I profile one frame and dump it out. Note that this screenshot above is with removing all calls to the STL in order to avoid information overload. Their time has been inserted into the time of the parents. The rest of the screenshots on this page include the STL.
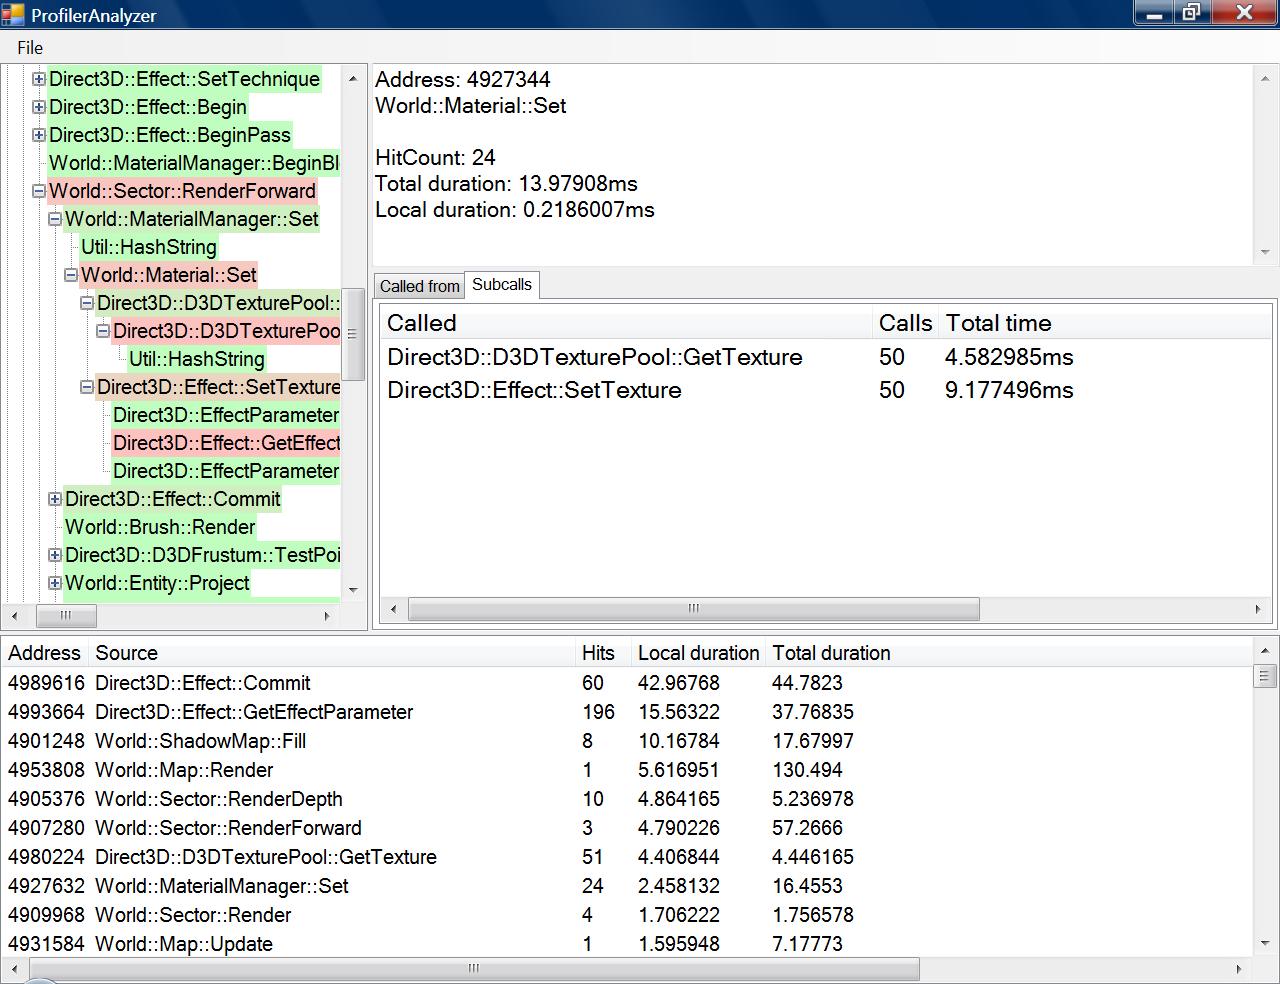
The bottom list is a flat list of all functions called, sorted by slowest to fastest according to local time, which is time within the function (recursion is included in local time) and not in a function called by the function. The tree on the left is my call graph, in order. To look at the most obvious bottleneck, I click on the top item of the bottleneck list. The total time of a call is the time within the call added to the sum of the total time of its subcalls. Sorting by total time would not help me locate bottlenecks as the local time may be very small (such as calling WinMain my most significant bottleneck).
A simple test scenario -- I have written a small deferred shader demo to try this out, with no CPU optimizations and making heavy usage of the STL libraries, as heavy as I can get without really doing badly on purpose. I profile one frame and dump it out. Note that this screenshot above is with removing all calls to the STL in order to avoid information overload. Their time has been inserted into the time of the parents. The rest of the screenshots on this page include the STL.
The bottom list is a flat list of all functions called, sorted by slowest to fastest according to local time, which is time within the function (recursion is included in local time) and not in a function called by the function. The tree on the left is my call graph, in order. To look at the most obvious bottleneck, I click on the top item of the bottleneck list. The total time of a call is the time within the call added to the sum of the total time of its subcalls. Sorting by total time would not help me locate bottlenecks as the local time may be very small (such as calling WinMain my most significant bottleneck).
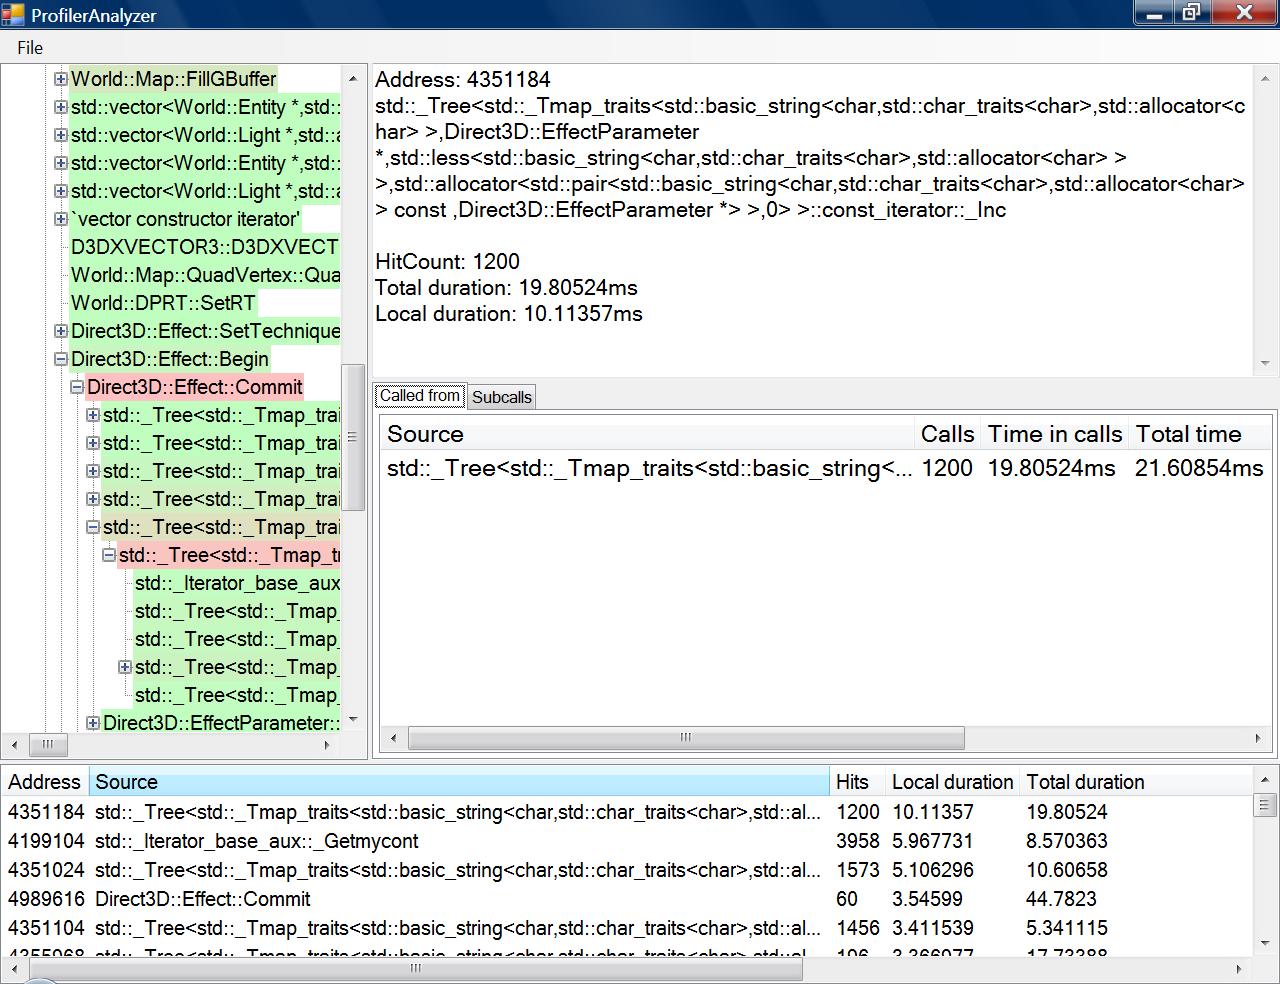 The analysis of the address comes up. Due to word wrapping in the text box, the resolved function name has bad linebreaks. An aggregated caller list comes up in the "Called from" tab. To the left, the call tree has located the region in which calls to this function took the longest total time. I can now either navigate the tree visually, or click on the slowest caller under "Called from". If the function that called this in the tree is not a bottleneck, the one under "Called from" will lead me to another point in the call tree, the slowest point for this caller function.
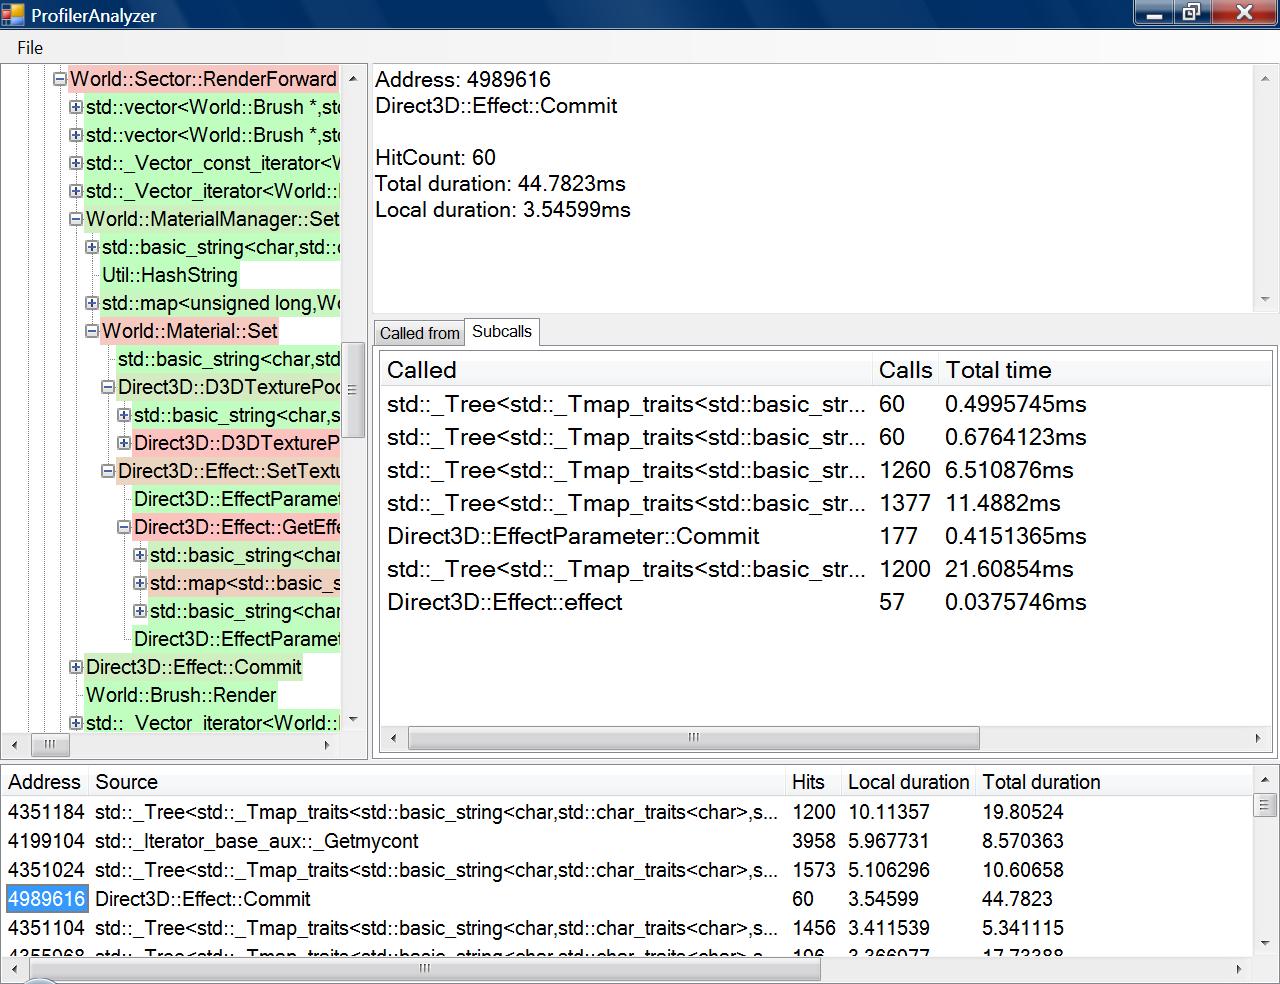
Using the slowest calls in the "Called from" tab, I pass through a few std calls until I end up in familiar code, Direct3D::Effect::Commit(). Note that in the first screenshot, in which the STL calls were not recorded, Effect::Commit() had a local time of about 43ms, but counting the STL calls seperately give it a local time of 3.5 ms, so STL usage really makes a difference in the performance of this function. The closer a color is to red, the greater percentage of time it takes up in its caller function.
The analysis of the address comes up. Due to word wrapping in the text box, the resolved function name has bad linebreaks. An aggregated caller list comes up in the "Called from" tab. To the left, the call tree has located the region in which calls to this function took the longest total time. I can now either navigate the tree visually, or click on the slowest caller under "Called from". If the function that called this in the tree is not a bottleneck, the one under "Called from" will lead me to another point in the call tree, the slowest point for this caller function.
Using the slowest calls in the "Called from" tab, I pass through a few std calls until I end up in familiar code, Direct3D::Effect::Commit(). Note that in the first screenshot, in which the STL calls were not recorded, Effect::Commit() had a local time of about 43ms, but counting the STL calls seperately give it a local time of 3.5 ms, so STL usage really makes a difference in the performance of this function. The closer a color is to red, the greater percentage of time it takes up in its caller function.
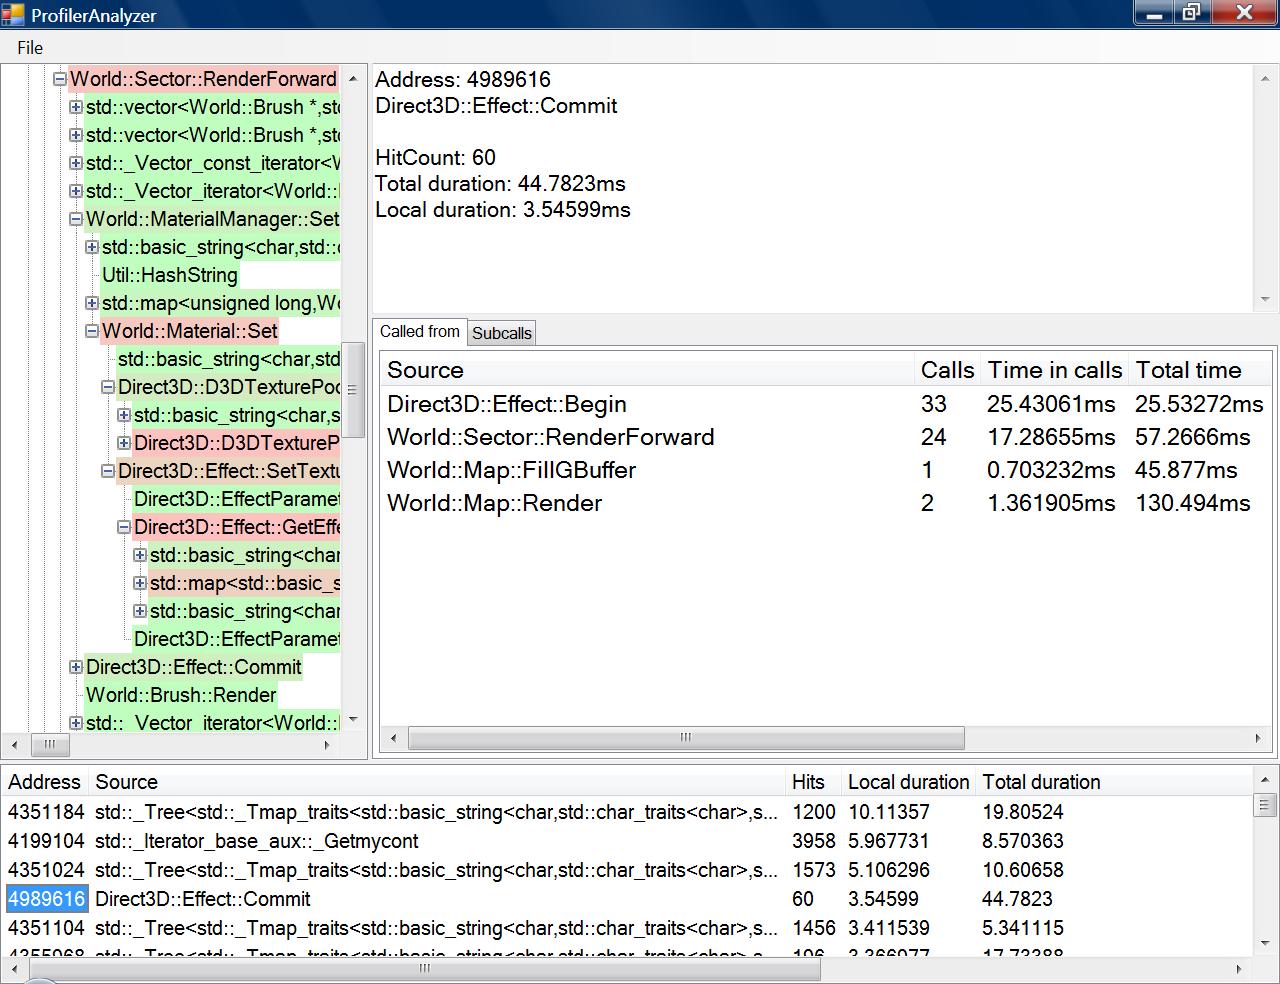 Flipping to the "Subcalls" tab, I now see that the bottleneck within Direct3D::Effect::Commit is not committing of parameters as I expected, but the iteration through the std::map which contains EffectParameters and their respective std::string handles. Switching these std::string handles out for integer hashes and using an array of pairs instead of std::map have resolved this bottleneck.